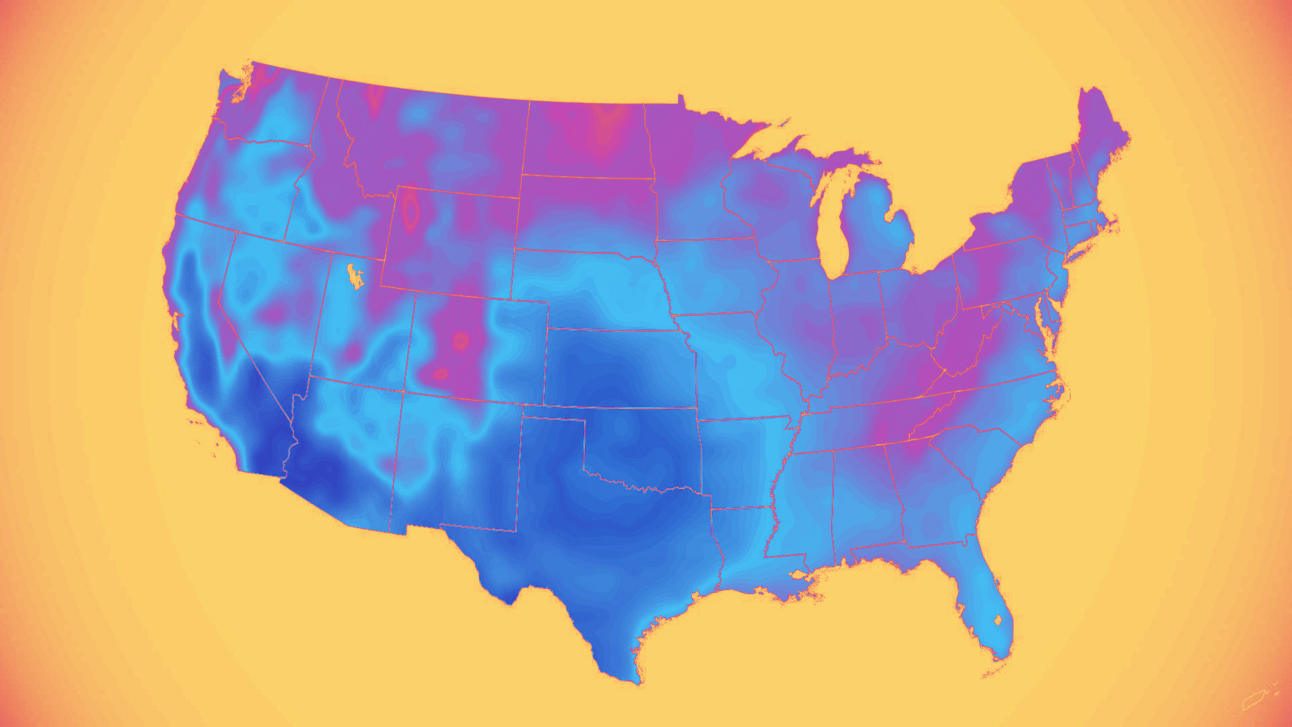
U.S. cooling demand below average as of June

Image: CNN
U.S. cooling demand has so far been slightly below the seasonal average compared to the past nine years, according to energy analyst John Kemp, based on National Oceanic and Atmospheric Administration (NOAA) data.
Background: Cooling Degree Days (CDDs) are a measure used to track energy use and cooling demand.
-
They’re calculated by subtracting 65°F from a day’s mean temperature. For example, if a day’s high is 92°F and the low is 68°F, the mean temperature is 80°F, resulting in a CDD of 15.
What’s happening: From January 1 to June 17, there were 292 cumulative CDDs across the lower 48 states, roughly 2% below the nine-year average of 297 during the same six-month period.
-
“Moderate temperatures have limited air conditioning and refrigeration and dampened electricity loads,” Kemp notes.
Yes, but: A major heatwave has expanded across the U.S. over the past week and a half.
-
“[T]he Lower 48 states have entered their first widespread sustained heatwave of the summer which will see a surge in electricity consumption over the next ten days,” he adds.
-
The NOAA’s 10-day outlook forecasts well-above-normal temperatures for most of the U.S. through June 29.
Of note: CDDs are tracked by “census division.” Since 2015, New England has recorded the least total CDDs, while the West South Central division (Texas, Oklahoma, Arkansas, Louisiana) has notched the most.
Looking ahead: Although CDDs are lower than average, year-to-date, the Energy Information Administration (EIA) projects 1,064 total CDDs from July through year-end, a 2% bump from 2023.
📬 Get our stories in your inbox
Keep reading
D.C. is changing. What’s ahead for the HVAC industry?
Since former President Trump won the election, a sea of changes, several of which will impact the HVAC industry, has been swirling in D.C.
“We would’ve lost the job without it”: Wisetack customers speak
In conversation with David Burris of Burris Heat and Air and Mike Soper of Abbott Brothers Plumbing & Heating
$13 billion proposal would double funding that supports the trades
An Illinois congressman in early June called for the doubling of federal funding for career and technical education (CTE) programs nationwide


