By the numbers: How U.S. consumers are actually doing
A look at six key indicators from the Federal Reserve over the past five years, as of December 2025

Image: Pexels
A lot’s happened since 2020 — a pandemic, an ensuing inflation surge, interest rate swings, a housing slowdown, a new administration.
To see how U.S. consumers are faring, Homepros pulled six key indicators from the Federal Reserve over the past five years, as of December 2025, the latest available figures.
Consumer Spending
Total consumer spending, in billions
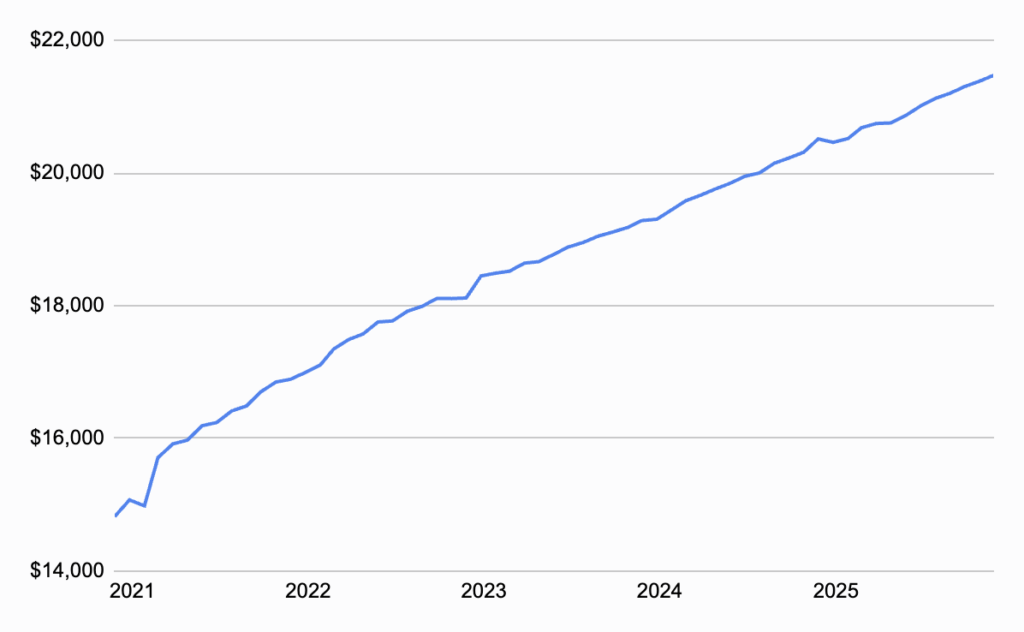
Through it all, Americans have continued to spend.
U.S. consumer spending — the primary driver of the economy, spanning everything from food and beverage to housing and utilities — rose 45 percent from December 2020 to December 2025.
But, but, but: 59 percent of all spending now comes from the top 20 percent of earners, a near record high, according to a late 2025 analysis. Go deeper
Real Disposable Income
Personal incomes less taxes and inflation, in billions
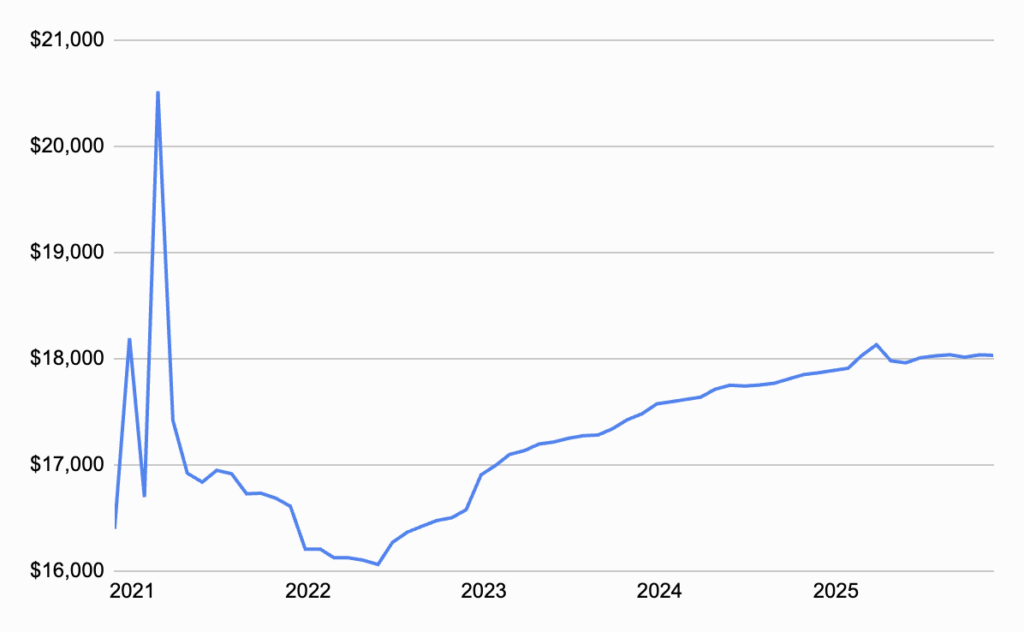
Americans’ real disposable income spiked in 2021, driven in part by stimulus checks issued by the federal government during Covid; however, the figure quickly settled and is up just 10 percent, all in, since December 2020.
Consumer Sentiment
A measure of consumer confidence
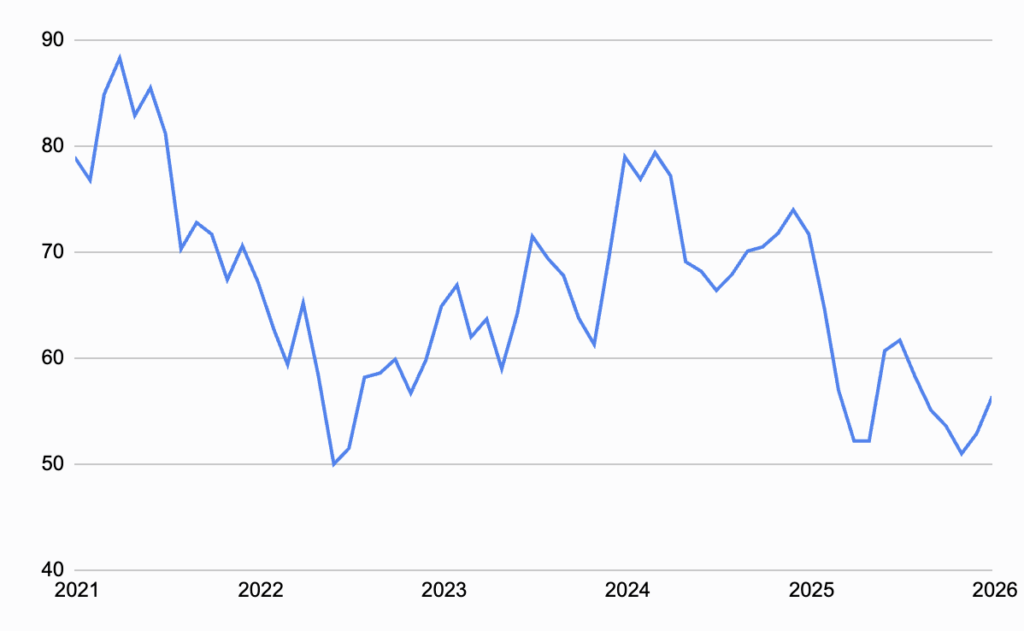
While U.S. consumer sentiment can fluctuate sharply from month to month, an index tracked by the University of Michigan, as of January 2026, remains 29 percent below its January 2021 level.
Meanwhile, the share of U.S. consumers who felt it was a good time to buy major household items — an indicator of HVAC purchasing intent — in December 2025 hit its five-year low, as Homepros previously reported. Go deeper
Personal Savings Rate
Personal savings as a percentage of disposable income
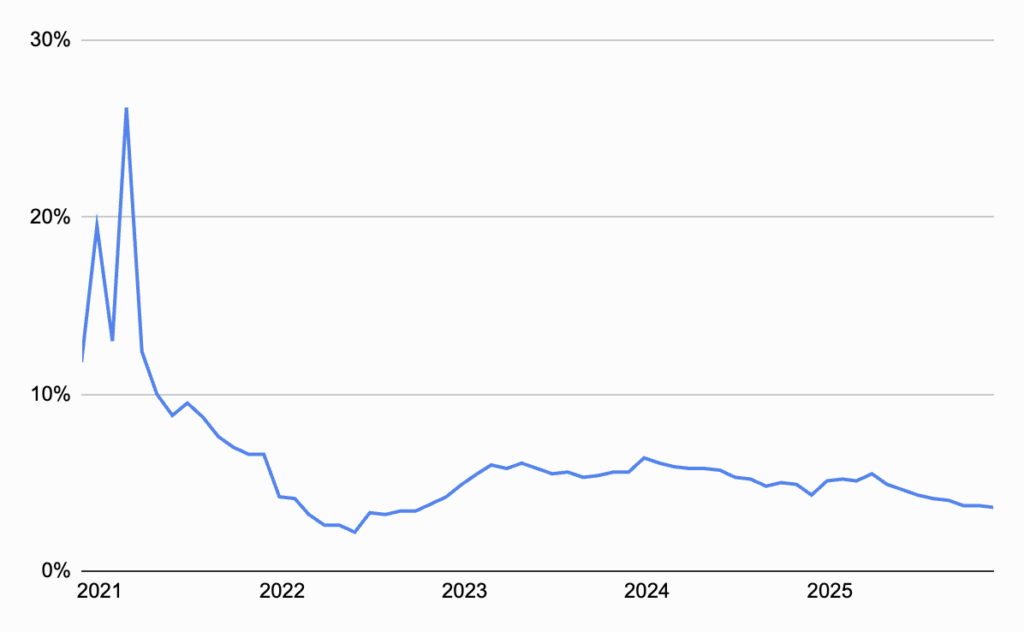
In December 2020, Americans saved 11.8 percent of their disposable income, according to the Bureau of Economic Analysis — boosted, like disposable income itself, by stimulus checks. However, in December 2025, the figure had fallen to 3.6 percent.
Debt to Income
Total household debt payments as a percentage of disposable income
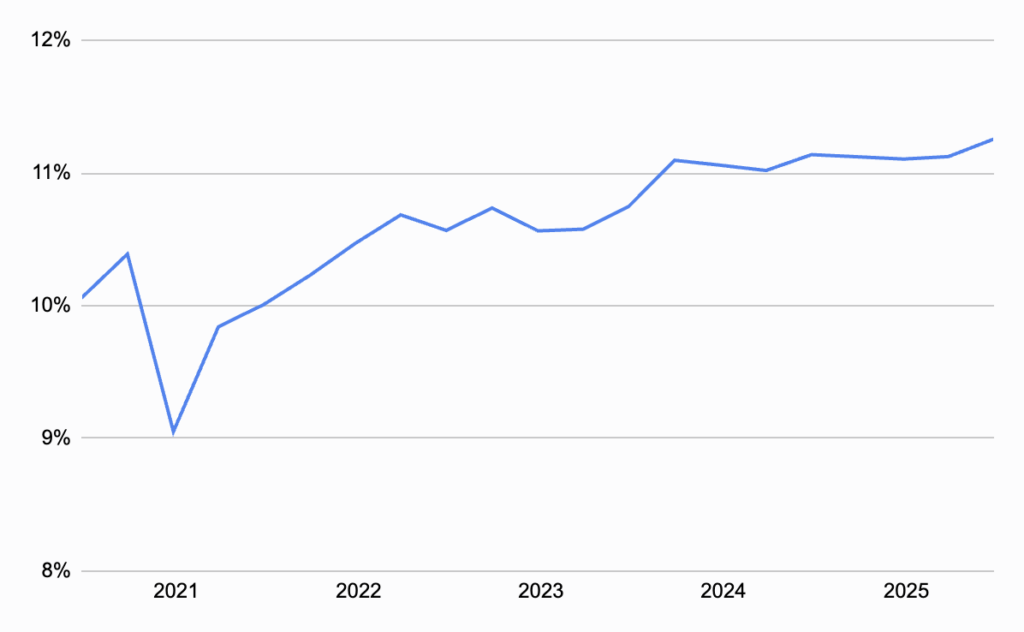
Total U.S. household debt payments, including mortgages and other loans, represented 11.3 percent of disposable income as of Q3 2025, the latest available data — that’s up from 10 percent five years earlier, in Q3 2020.
Credit Card Delinquencies
Percentage of credit card accounts at least 30 days past due
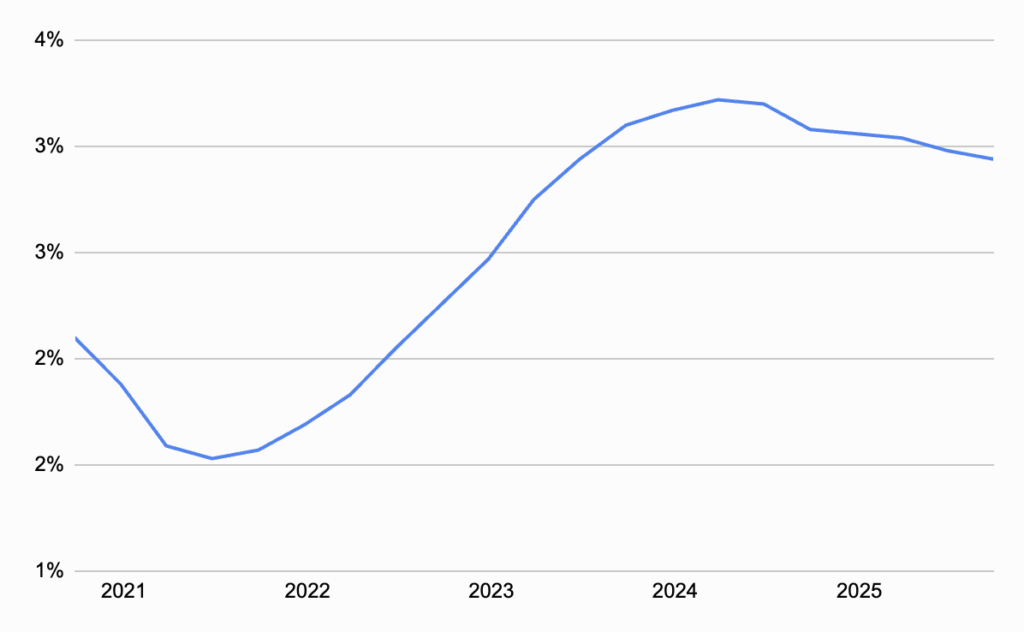
As of Q4 2025, 2.9 percent of U.S. credit card accounts had balances that were at least 30 days past due. While that’s up slightly from the same period in 2020, the figure has trended downward every quarter since Q2 2024, when 3.2 percent of accounts were considered delinquent.
Editor’s note: All data was sourced from the Federal Reserve’s online economic database.
📬 Get our stories in your inbox
Keep reading

StreamLabs inks Orlando Magic partnership
The company’s leak detection technology has been installed throughout the Magic’s training facility, according to an announcement

Trump to renegotiate Mexico-Canada trade deal, HVAC exemptions safe for now
The trade agreement that currently provides HVAC products from Canada and Mexico with tariff exemptions will likely be renegotiated next year

HVAC buying indicator dips in August, survey finds
The share of U.S. consumers who felt it was a good time to buy major household items fell slightly in August, per the University of Michigan